
The "h-index" was introduced in 2005 as a metric for estimating "the importance, significance and broad impact of a scientist’s cumulative contributions." It takes into account both the number of an individual’s publications and their impact on peers, as indicated by citation counts. Its creator, Jorge Hirsch (UC-San Diego) asserts that a "successful scientist" will have an h-index of 20 after 20 years; an "outstanding scientist" will have an index of 40 after 20 years; and a "truly unique individual" will have an index of 60 after 20 years or 90 after 30 years. A link is provided here (http://www.pnas.org/cgi/content/full/102/46/16569).
Out of curiosity, I compared this with "quarterback rating" calculations. Here are a couple of calculators you can fill in:
Quarterback Rating Online Calculator
Not to compare # of pass attempts with completions and yards with touchdowns and interceptions, but in short if you have a lot of uncited papers, peer-reviewed, published, etc… it may actually affect your h-index to be lower score as opposed to a "successful QB" who may complete fewer successful passes for positive yards, particularly without interceptions. Anyways, h-index much easier to calculate as a function of # of papers published and heavily cited. Here is the actual calcuation used by the NFL. The NCAA, arena leagues and Canadian football leagues use comparable statistics for rating purposes. You can fill in scenarios for both h-index and QB rating to see what I mean.
Passer rating is determined by four statistical components, each of which is computed as a number between zero and 2.375. The benchmarks for these statistics are based on historical averages. If any of the components are less than zero, they are reckoned as zero; if any are over 2.375, they are reckoned as 2.375.
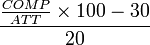
- The component for completion percentage, C, is calculated as:
- The component for yards per attempt, Y, is calculated as:

- The component for touchdowns per attempt, T, is calculated as:

- The component for interceptions per attempt, I, is calculated as:

The four components are then added, divided by 6, and multiplied by 100. Thus, the formula for passer rating can be given as:
The Abstract from the original PNAS paper:
I propose the index h, defined as the number of papers with citation number is [equal or greater than] h, as a useful index to characterize the scientific output of a researcher. And here is the rationale from the paper: Why would you try to quantitatively measure a scientist’s influence? For the few scientists who earn a Nobel prize, the impact and relevance of their research is unquestionable. Among the rest of us, how does one quantify the cumulative impact and relevance of an individual’s scientific research output? In a world of limited resources, such quantification (even if potentially distasteful) is often needed for evaluation and comparison purposes (e.g., for university faculty recruitment and advancement, award of grants, etc.).
Curious to know your own h-index? You can easily determine it using Web of Science. Select "Science Citation Index Expanded." Click "General Search" category and search for your name as author (e.g., SMITH J*). Use "Refine Your Results" by Institution to differentiate yourself from other scientists with the same initial(s). (This is an important step, otherwise your publications will be intermingled with unrelated papers and your h-index will be inaccurate.) Click on "Citation Report" in the box on the right side. Your h-index will be calculated automatically. An alternative method is to sort your citations by "Times Cited", using sort box on the right side. Scan down the list until the number of the paper exceeds the number of citations to that paper. For example, your h-index is 20 if your 21st paper has been cited 20 or fewer times, but your 20th paper has been cited 20 or more times.
Benefits of the h-index:
– It is quantitative.
– It takes into account not just the number of publications or how well a couple of publications are cited, but the QUANTITY of well cited publications.
– Older, well established professors will have accumulated many citations for initial work that is still relevant. Thus h-index goes up with time.
– As you increase your h-index number, it becomes harder to increase it further.
Problems:
– Self citations. Although this could easily be eliminated.
– Papers which are wrong. This is not so bad. If you are influential, by definition, people will have to confront and address your "bad data" and explain why it is wrong.
– Cross field comparison. Currently biologists have much higher h-indexes than physicists, simply because there are more scientists who study biology (and thus more individuals who can cite you). Even within biology, it looks like researchers studying signal transduction and oncogenes get a boost to their h-index.
One problem with these lists … we did the searches on ISI, but could not account for papers where the middle initial was omitted so the true values for some researchers may be slightly higher …
I’ll end with this quote from Hirsch’s PNAS paper:
In summary, I have proposed an easily computable index, h, which gives an estimate of the importance, significance, and broad impact of a scientist’s cumulative research contributions. I suggest that this index may provide a useful yardstick with which to compare, in an unbiased way, different individuals competing for the same resource when an important evaluation criterion is scientific achievement.


