Visiopharm Introduces HISTOmap – A New Software Tool to Understand Tumor Heterogeneity

 Assessment of relevant quantitative data from tumors by histology is a cornerstone of cancer research and diagnostics. Today it is a challenge to understand, define and quantify tumor heterogeneity in a way that has practical utility for scientists and pathologists.
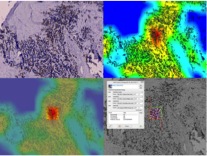
Heterogeneity is seen as non-uniform manifestation of biomarker expression across tissue sections, in which higher expression areas (hot spots) and lower expression areas are present. Heterogeneity can be seen as a heat map of biomarker expression, where the hot spots are the peaks of the heat map.
HISTOmap™, a new software tool from Visiopharm, makes it possible to use heat maps based on tissue properties quantified with image analysis APPs in any type of image. Combined with VISIOmorph™ and TISSUEalign™ it opens possibilities to,
- Separate tumor, stroma and in-situ components automatically.
- Visualize, analyze and quantify tumor heterogeneity by heat maps based on tissue properties within tumor tissue.
- Identify and automatically delineate hot spots within tumor tissue.
- Determine biomarker expression, and/or any tissue property, within these hot spots.
In the proliferation quantification of Ki67, assessment of labeling index in hot spots is advised in many local and national guidelines. Recent studies even suggest that assessment in the hottest hot spot is important (Gudlaugsson et. al; Histopathology; 2012). Automated region selection in heat maps, combined with Visiopharm’s CE-IVD APPs for the breast panel, automates the image analysis workflow including counting within hot spots, as advised in guidelines.
Join Visiopharm this week for our webinar “Understand Tumor Heterogeneity with HISTOmap™ from Visiopharm” on February 11, 2015 at 7 AM PST / 10 AM EST / 4 PM CET. This webinar will give an insight into the ideas and possibilities of the new HISTOmapTM tool. Specific examples of visualization and automated location of hot spots, in Ki67 label index of breast cancer, by heat maps will be shown. This includes the fully automated counting of positive and negative cells, limited to 500-1000 cells in hot spots, to assess the label index on a full tissue section.